I want to start off by saying that Perl has to be one of the most fantastic languages I’ve every had to work in. I’m not really learning it because I have a keen interest in Perl, I’m learning to be helpful regarding the legacy codebase at my work.
A little grind goes a long way…
I wrote a bit of a script, after spending a few weeks perusing through a hefty codebase, and even with a little bit of Programming Perl under my belt, I still don’t have the skill to just roll out a lot of code off the top of my head. To make sure I was putting some test coverage in place (of which there isn’t in this particular project), I looked up Test::Simple and Test::More and started the file that would house my tests.
I found after I have covered the existing code that I was looking at my new function stubs, and wondering how to best describe what they were going to do. Without even really thinking about it, I started writing tests to say, “It should do this, or that” and in a couple minutes I had created a spec for the function I was writing.
Almost like fun
The neat thing is, having the spec in place allowed me to play with the code a little bit to see if it was doing what I wanted when I tried different things. If you recall, Perl has that “There Is Moar Than One Way To Do It”(TM) thing, which can be a good and a bad thing, but more about that later.
The real fun is when I made the realization that I was actually doing Test Driven Development to learn Perl. TDD is something I’ve always thought would benefit my coding style, but I never really realized how until today.
I’ve started helping out with a little bit of sysadmin at work, since our systems team is swamped most of the time. My task is to do an audit on our Nagios system and make sure everything is up to snuff. We’re running Nagios 3 on one machine and NRPE to pull performance data from the cluster (about 20 machines). NRPE is a plugin to execute scripts remotely to gather performance data.
Nagios can do both active and passive measurements, meaning it can execute scripts remotely, or sit and listen as your machines push data into it. We’re only using the remote execution method (via NRPE). One of the downsides to this is having to set up new machines with the scripts and plugins for Nagios. You have to set up both the script and config on the remote machine, and then configure the Nagios machine to know what scripts to run remotely. Even with all that, it does a good job, and seems fairly performant.
Graphs and more graphs
Nagios has some good graphs for reviewing performance data, and lots of options for configuring and customizing things based on your preferences. However, like many aging open-source projects, Nagios feels a little clunky, and it’s graphing system, while extendable (by the looks of things) isn’t quite as shiny as some of the newer systems I’ve looked at.
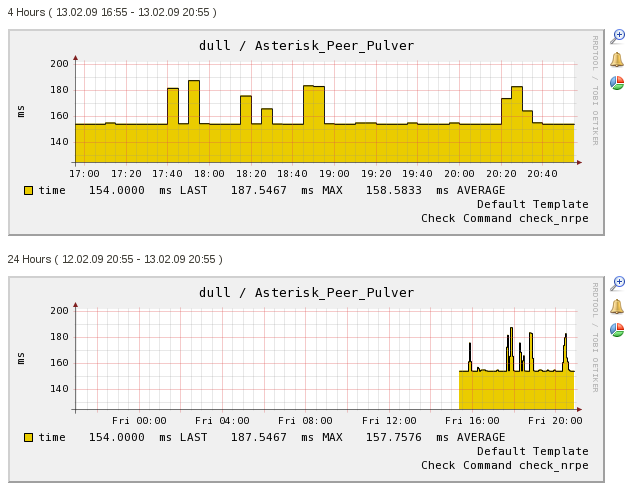
A typical Nagios graph looks like this (image from IT Slave):
The graphs are really good as they stand, you can zoom in to find out more detail on a set of measurements, and you can stack your measurements together for correlation, but it’s not very user-friendly, and requires nearly a sysadmin to accomplish.
Correlating data
One of the interesting things about having a lot of measurements, is finding fun and interesting ways to mash them together. I ran into Librato Metrics the other day while looking at some different options for graphing systems information in the cloud. I don’t want to replace Nagios, by any means, for what it does, it does really well.
What I want is a better way to correlate data.
Librato Metrics has an api available for several languages so you can post metrics information to their system on the fly. Compared to Datadog (which also looks very awesome, btw) who charges $15/host/month, Librato Metrics charges based on measurements, and they have a nifty little chart on their pricing page to give you an idea of the cost to use their service. According to that page, each measurement is going to cost you $0.000002 per measurement.
I did the math, for the ~180 measurements we run at work every 90 seconds, it would cost us about $12/month to use their service (compared to ~$300/month on Datadog for 20 hosts). The flip side to that is, Datadog has a whole bunch of 1-click integration scripts to get up and running, while Librato is still a bit of a WIP in that area. No skin to me.
So what do they offer?
Librato Metrics is really a data aggregation service, they offer the ability for you to create measurements with a namespace and a source, and then give you a myriad of ways to graph and correlate that data using instruments. Don’t just take it from me, go check out their video and see for yourself.
Some of the things that make this system fairly attractive is the use of Highcharts for the graphing, and a really slick theme that is nice to look at. Their dashboards are a fancy way to mash a whole bunch of instruments into one place.
A poor demo
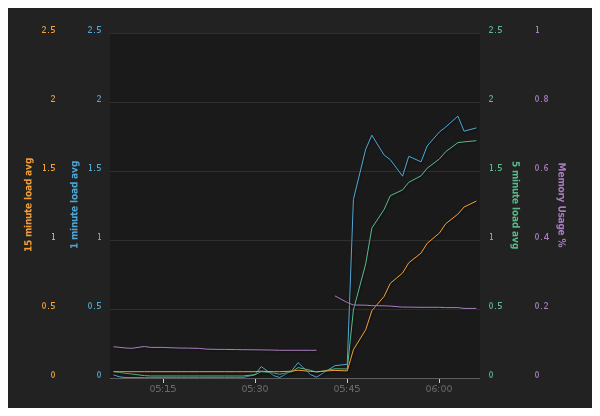
I’ve only had limited time to get started with the system, but I wrote a quick little demo script in node.js (of course) and tried it out on my EC2 instance.
For the demo I pushed load averages at 1, 5, and 15 minutes, as well as free memory on the machine (measured between 0.01 and 1.00).
Here’s the result:
To get the performance data, I just pulled down node-fibonacci and asked my EC2 machine to calculate the fibonacci sequence for to a ridiculous length (three million trillion or something)… needless to say, it stressed out the machine a bit…
It basically takes an OS measurement on CPU and calculates free memory every 90 seconds. Then it pushes that information to librato, and carries on. Since it’s node, the whole operation happens asynchronously and everybody’s happy.
HipChat
Did I mention they have 1-click “send this snapshot to HipChat“ also? That’s just fun.
Happy happy!
There you have it, fun fun. Can’t wait to start profiling some scripts and aggregating some other data with this thing.